Financial Aid Application Completion Blog
Financial Aid Application Completion Blog
“We’ve had a lot of success helping people transform [data from the state agency] to something that is more actionable and useful to the work they are trying to do.”
— Ben Sanoff, Director of Data Analytics for CARPE College Access Network

Introduction
Practical measures aren’t necessarily about collecting more data or designing something totally new. Most school systems have more data than they know what to do with. Instead, what if we took data that was already available and made it useful? The Financial Aid Application Completion measure does just that. Using extant data from the state education agency, this measure provides information to school staff that is timely and actionable, fueling their improvement efforts.
The Need for Measurement
The CARPE College Access Network,which includes over 30 high schools in Southern California, is focused on increasing the percentage of students who are Black, Latinx, indigenous, or from low-income backgrounds who apply, enroll, and ultimately go to colleges they are likely to graduate from. To meet this aim, the network identified three primary areas to focus on: 1) financial access, including the completion of financial aid applications; 2) college application and enrollment; and 3) decreasing “summer melt” (ensuring that students enroll in college once admitted).
As the improvement effort was getting started, the network analytics team discovered that most schools lacked tools to track college applications and enrollment as well as summer melt. Collecting this information proved to be challenging for schools, because it required following up directly with students. To circumvent these logistical challenges, the network analytics team began to wonder, What data related to our theory of improvement is already available? This led them to data regarding the submission of college financial aid applications that was reported by the California Student Aid Commission (CSAC). The team decided to find a way to share this information back to the schools in their network so that it could inform their processes for supporting students.
The Measure: Financial Aid Application Completion
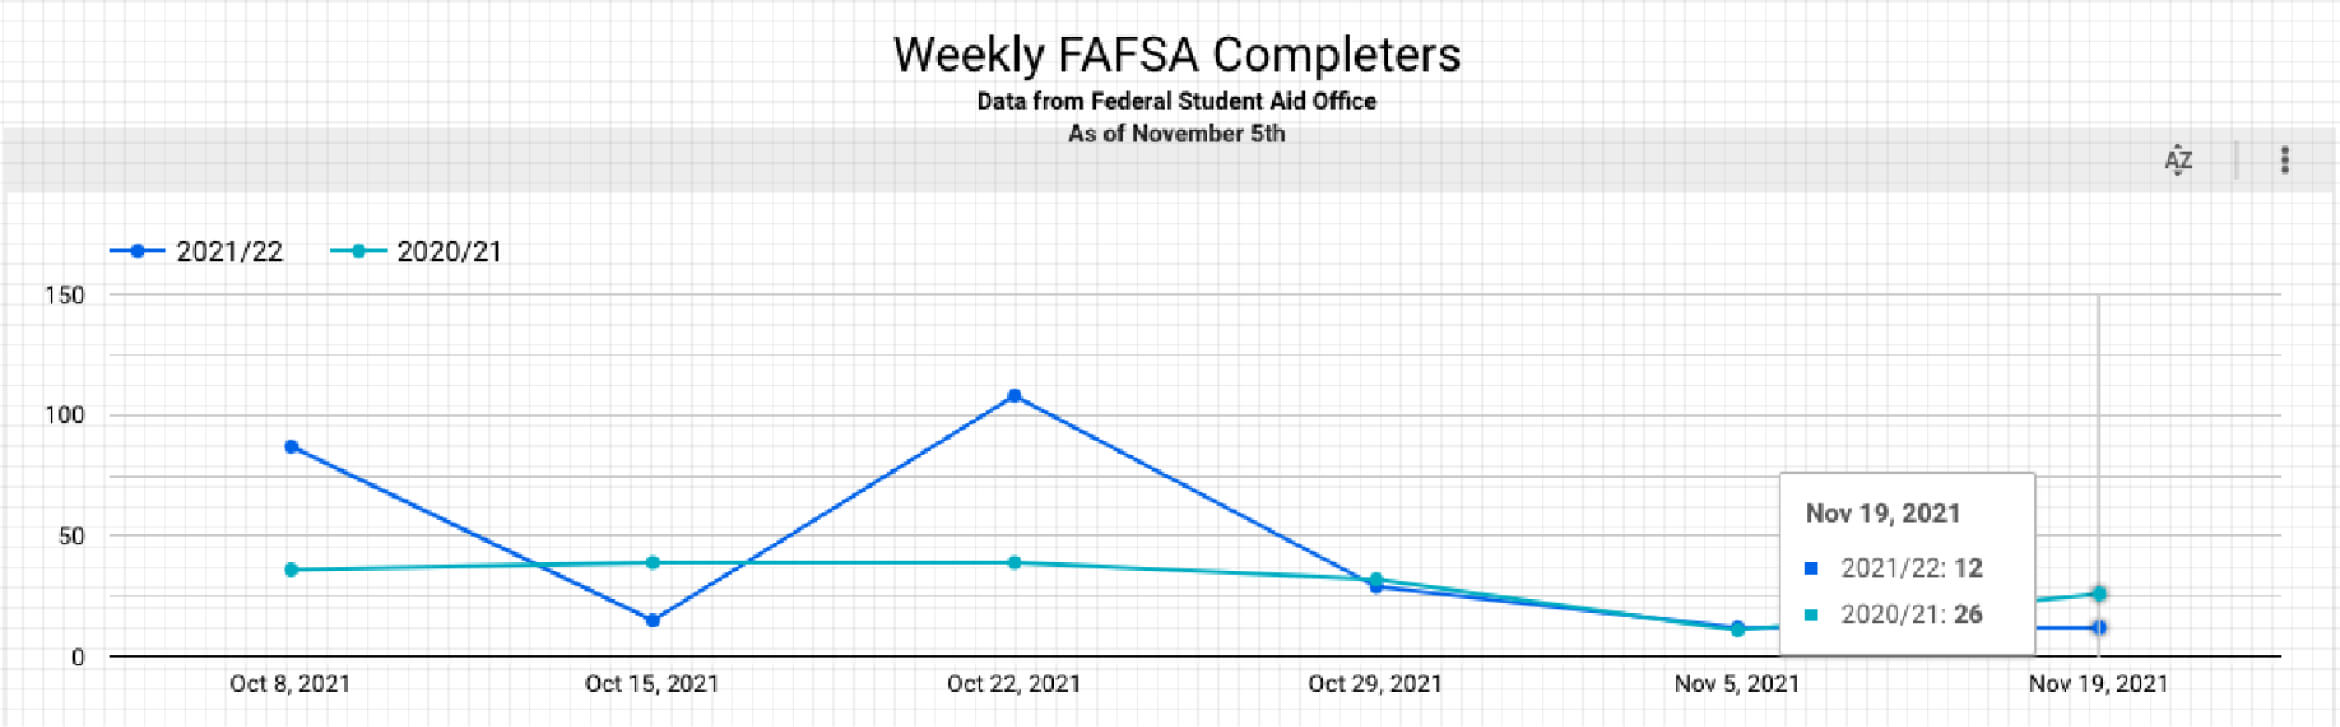
Without financial support, many students are less likely to attend college. This measure tracks a key lever in the network’s theory of improvement, and ensures that this potential barrier to college attendance is addressed. Based on data reported by the CSAC, the network analytics team developed an online dashboard for each school that displays the number and percentage of students who have completed financial aid applications. The dashboard also includes a run chart that shows the number of financial aid applications completed each week and as compared to the prior year (see Figure 1). Each school is asked to set a goal for the percentage of students they want to complete financial aid applications. Using this target, the dashboard displays the number of applications that are still needed and how many applications will need to be submitted each week (prior to the deadline) in order for the goal to be met.
Figure 1. Sample run chart from the school dashboard displaying number of applications completed each week compared to the previous year
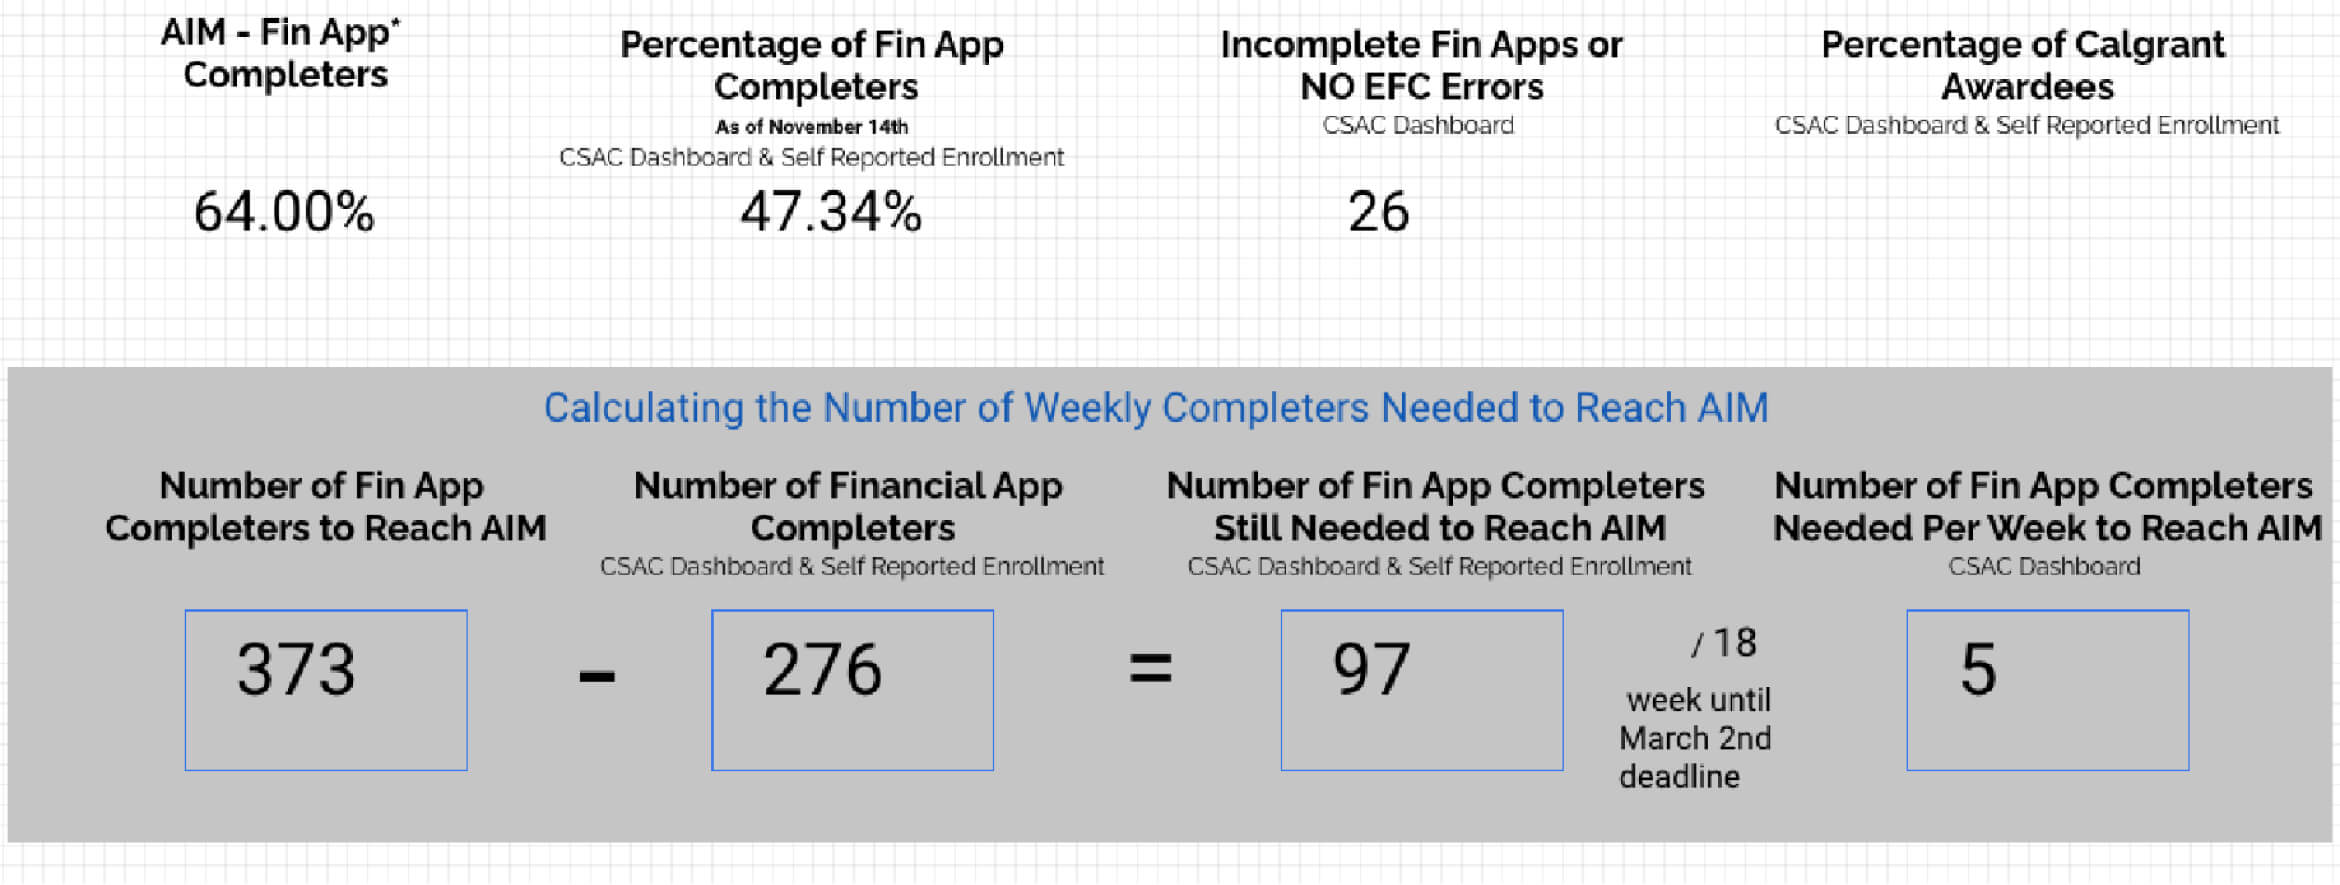
One of the key features of a measure for improvement is that it serves as a signal for actions users can take. To this end, the data collected using the Financial Aid Application Completion measure is organized and displayed in multiple formats to support different users engaged in the improvement effort. For example, school administrators might refer to the dashboard to identify the percentage of students who have already completed applications and the number of students completing applications each week to determine if the school is on track to meet its aim (see Figure 2). Based on this information, the administrator can assess their current processes and determine if new processes or strategies might be needed to promote further progress. Additionally, a school counselor can review the by-student data to determine which students have not completed their application and use that information to guide their outreach to students and families. Having this information allows school staff to more effectively design processes to support students as they apply for financial aid, illustrating another feature of measurement for improvement: it is seen as valuable to the target users.
Figure 2. Sample table from the school dashboard displaying the percentage of completed applications and progress toward aim
Insights from Using the Measure: Transforming extant data into actionable information
To develop this measure, the network analytics team started with determining what data to pull and where. Their first guiding question was: What do schools need? The answer was surprisingly simple: Schools needed to know which students had not yet completed financial aid applications.
Next, they asked: What is missing or needed from public data reported by the state? The state report only provided aggregate data regarding the number of financial aid applicants from a school and listed the names of students who had completed the application. However, what schools really needed to know was the names of students who had not completed the application, so that school staff could clearly identify the students to follow up with.
The third critical question was: How do we make the state data useful so that it can support our improvement efforts? The network analytics team developed a weekly routine for downloading the data from the state website and uploading it to the hub’s data system to populate the dashboard, which allows network leaders and school staff to easily monitor progress that teams are making toward their goal. Additionally, a data lead from each school uploads the by-student data file to the network’s database platform every other week (or provides the file to the hub to do so). This information is used to create a table for each school that includes the names of students who need to complete a financial aid form or who have an error that needs to be addressed. The hub also supports schools in determining which students to prioritize for follow-up and assigning tasks to appropriate staff.
Impact of Measurement for Improvement
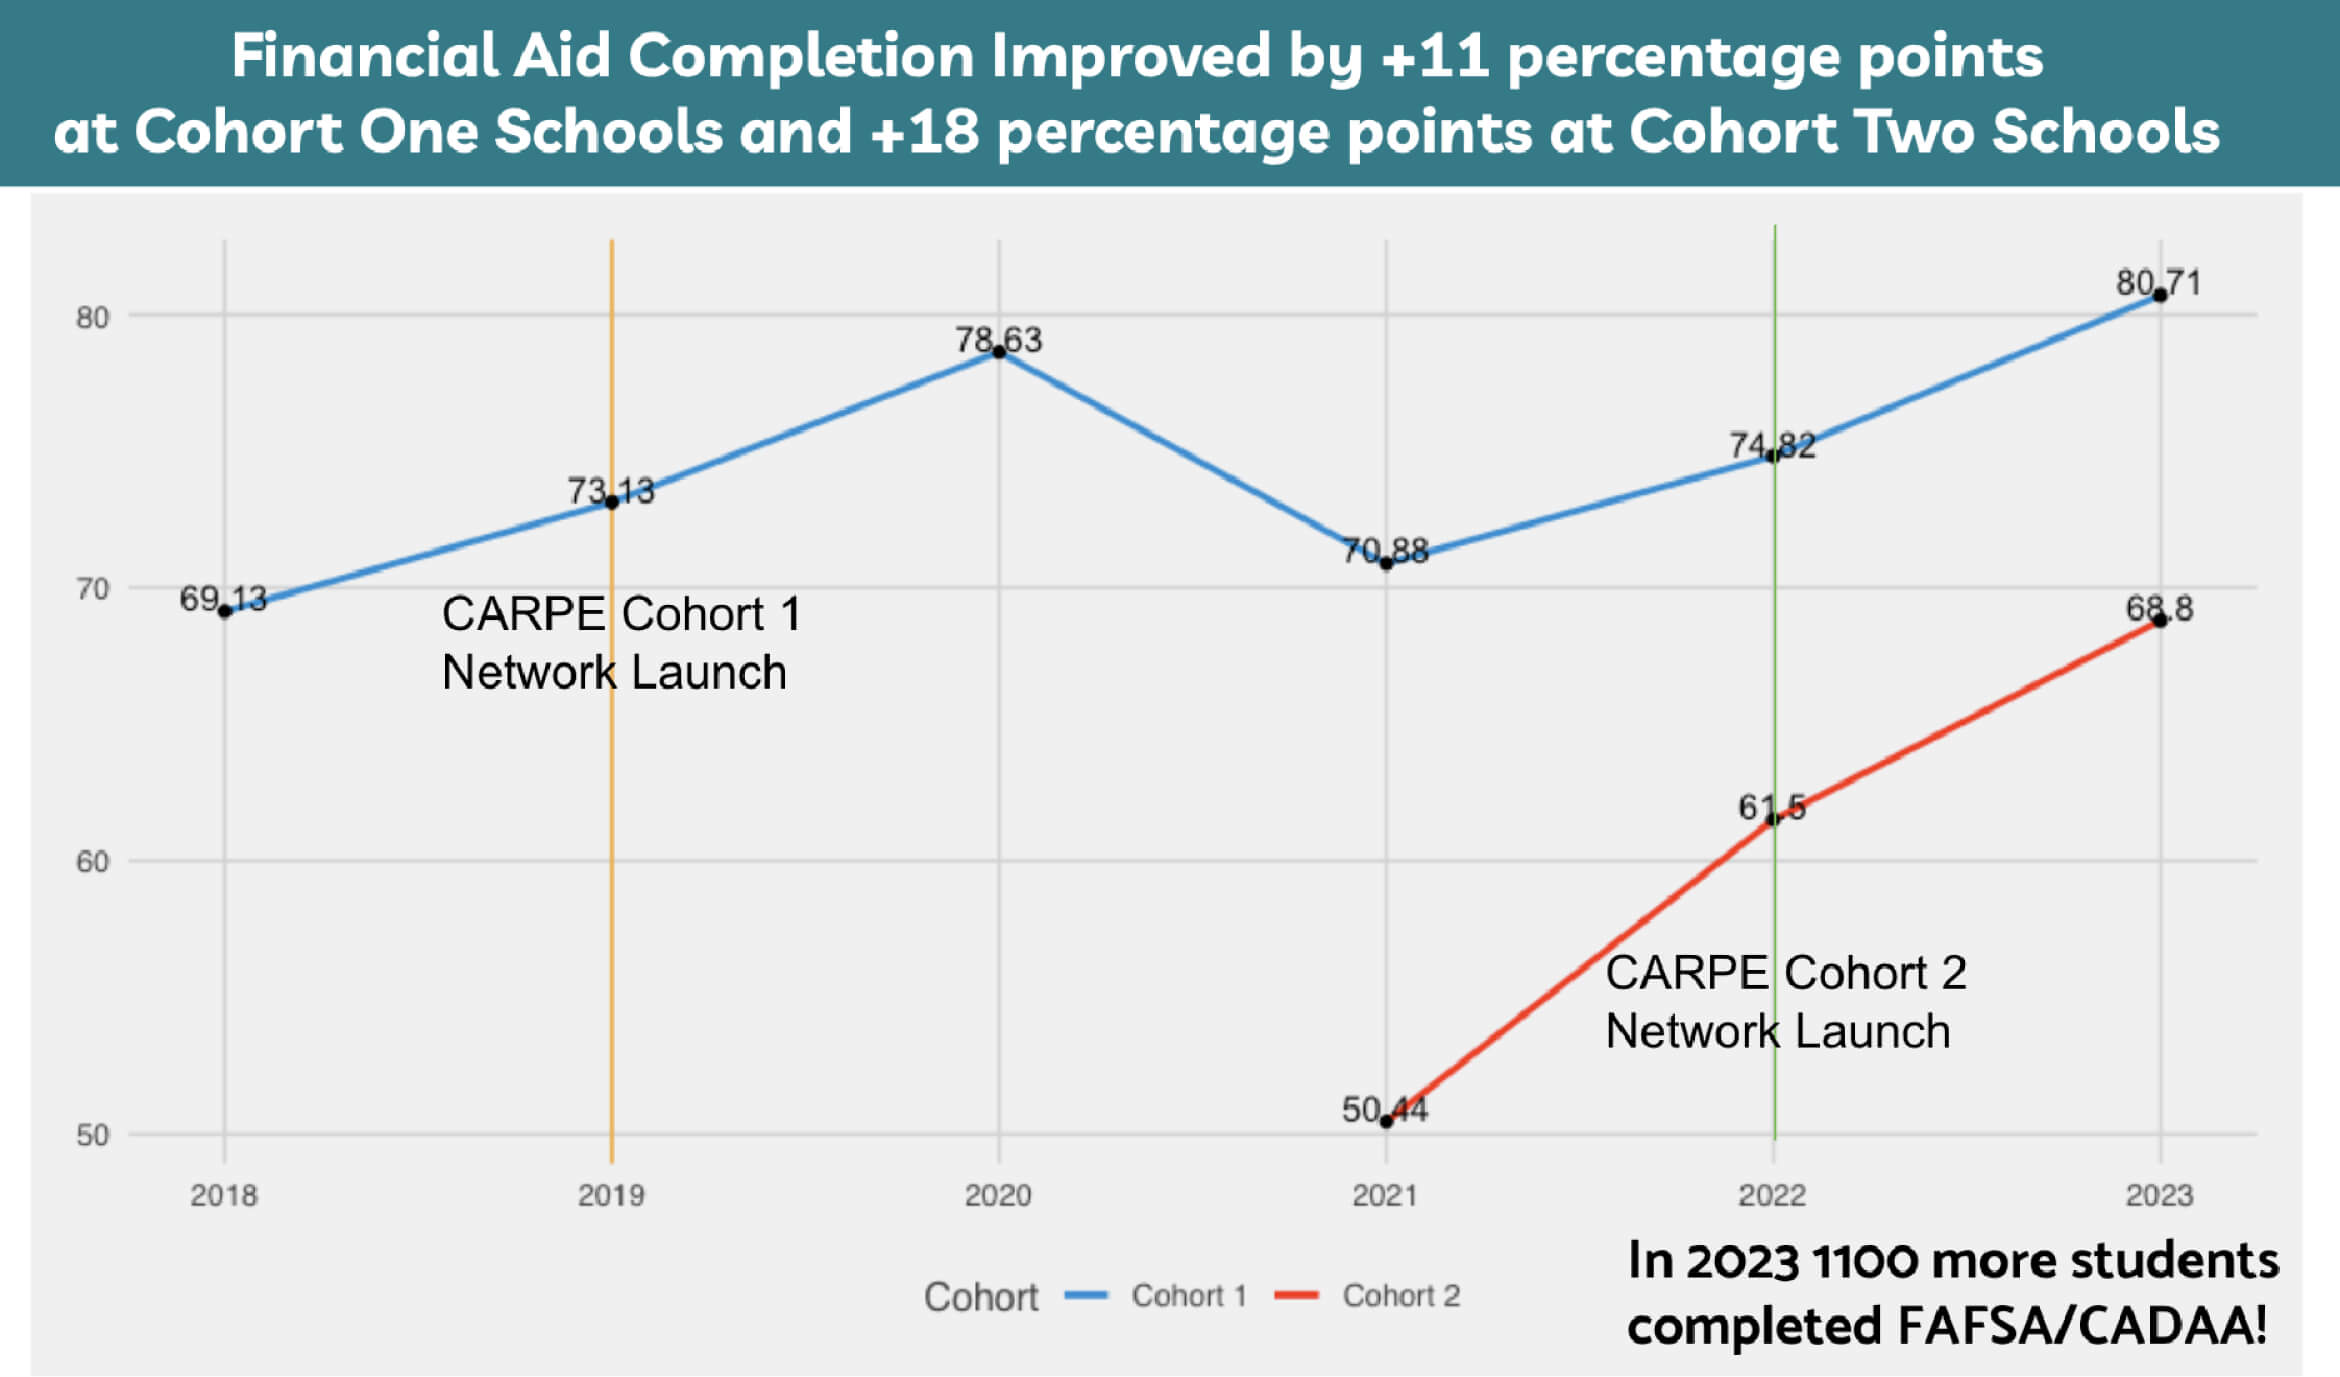
Using the Financial Aid Application Completion measure has encouraged school teams to shift their mindset about how to best support students in their college journey. Instead of waiting to provide assistance to students who ask for it, college counseling teams review the data and take a more proactive approach by providing support for students who need it at that moment. Additionally, this measure effectively transforms state-level aggregate data into practical information that school teams can use to design interventions that increase college access for traditionally underrepresented students. According to CARPE College Access Network’s website, schools in their network have measurably increased college access and improved financial aid completion rates by 11 percentage points for schools that joined the network in 2019 and 18 percentage points for schools that joined in 2021.
Figure 3. Chart showing percentage of students who applied for financial aid utilizing the FAFSA or California Dream Act Application (CADAA) at network schools from 2018-2023
Related

TECHNICAL PAPER
Financial Aid Application Completion
The Financial Aid Application Completion measure is used as a driver measure to monitor shifts in financial access, which is…
You may also be interested in…

RESEARCH BRIEF
Developing Exit Tickets in an Improvement Network
Ms. Johnson, an English teacher at an urban middle school, was concerned that her students were not doing as well in her class as they could be. Her district had recently…

RESEARCH BRIEF
Case Study of ORF as Practical Measure Brief
In this post we describe the identification and use of Oral Reading Fluency (ORF), a common and widely used Curriculum Based Measurement (CBM) measure, as a…