Participation Measure Blog
Participation Measure Blog
“During the pandemic it was very difficult for students to log onto classes that were synchronous because they were in parts of Chile that are very rural and they didn’t have access to the internet, so the foundation looked for different ways to measure how students were participating in learning.”
— Pablo Muñoz, Head of Continuous Quality Improvement and Evaluation for the UBC Improvement Network
Introduction
In order to be “practical,” a practical measure for improvement must take into account the specific context in which it is being used – the time, the place, and the situation. It must be relevant and provide data that help practitioners address the challenges they are currently facing. Effective measures are often born out of practitioners reflecting on questions like What do we need to know right now to do our job well? and What information will help us better support our students or families in the current context? These kinds of measures reflect an unspoken urgency around improving the target outcomes. The Participation Spreadsheet/Tracker was designed to address specific challenges related to student participation during the COVID-19 pandemic. It highlights the importance of creating measures that are responsive to the needs of front-line improvers while taking into account their context so that practitioners have access to the information they need to improve their practice and processes.
The Need for Measurement
The Un Buen Comienzo (UBC) Improvement Network, supported by Fundación Educacional Oportunidad, focuses on improving early childhood education in Chile. Since its founding in 2018, the UBC Network has sought to create a space for collaboration, professional development, and pedagogical innovation among its network members representing over 150 schools across two regions in Chile.
Prior to the COVID-19 pandemic, the network focused on improving language outcomes for first- and second-year students in Early Childhood and Care programs (NT1 and NT2), which includes pre-kindergarten- and kindergarten-aged children from 4 to 6 years old. One of the primary drivers identified to achieve this goal was reducing the percentage of students who were chronically absent during the school year – missing more than 10% of school days (see Figure 1). To support this effort, the network hub leveraged data that was submitted by schools to the Chilean Ministry of Education through the General Student Information System to develop a platform that allowed them to track absenteeism across schools and specific classrooms in their network.
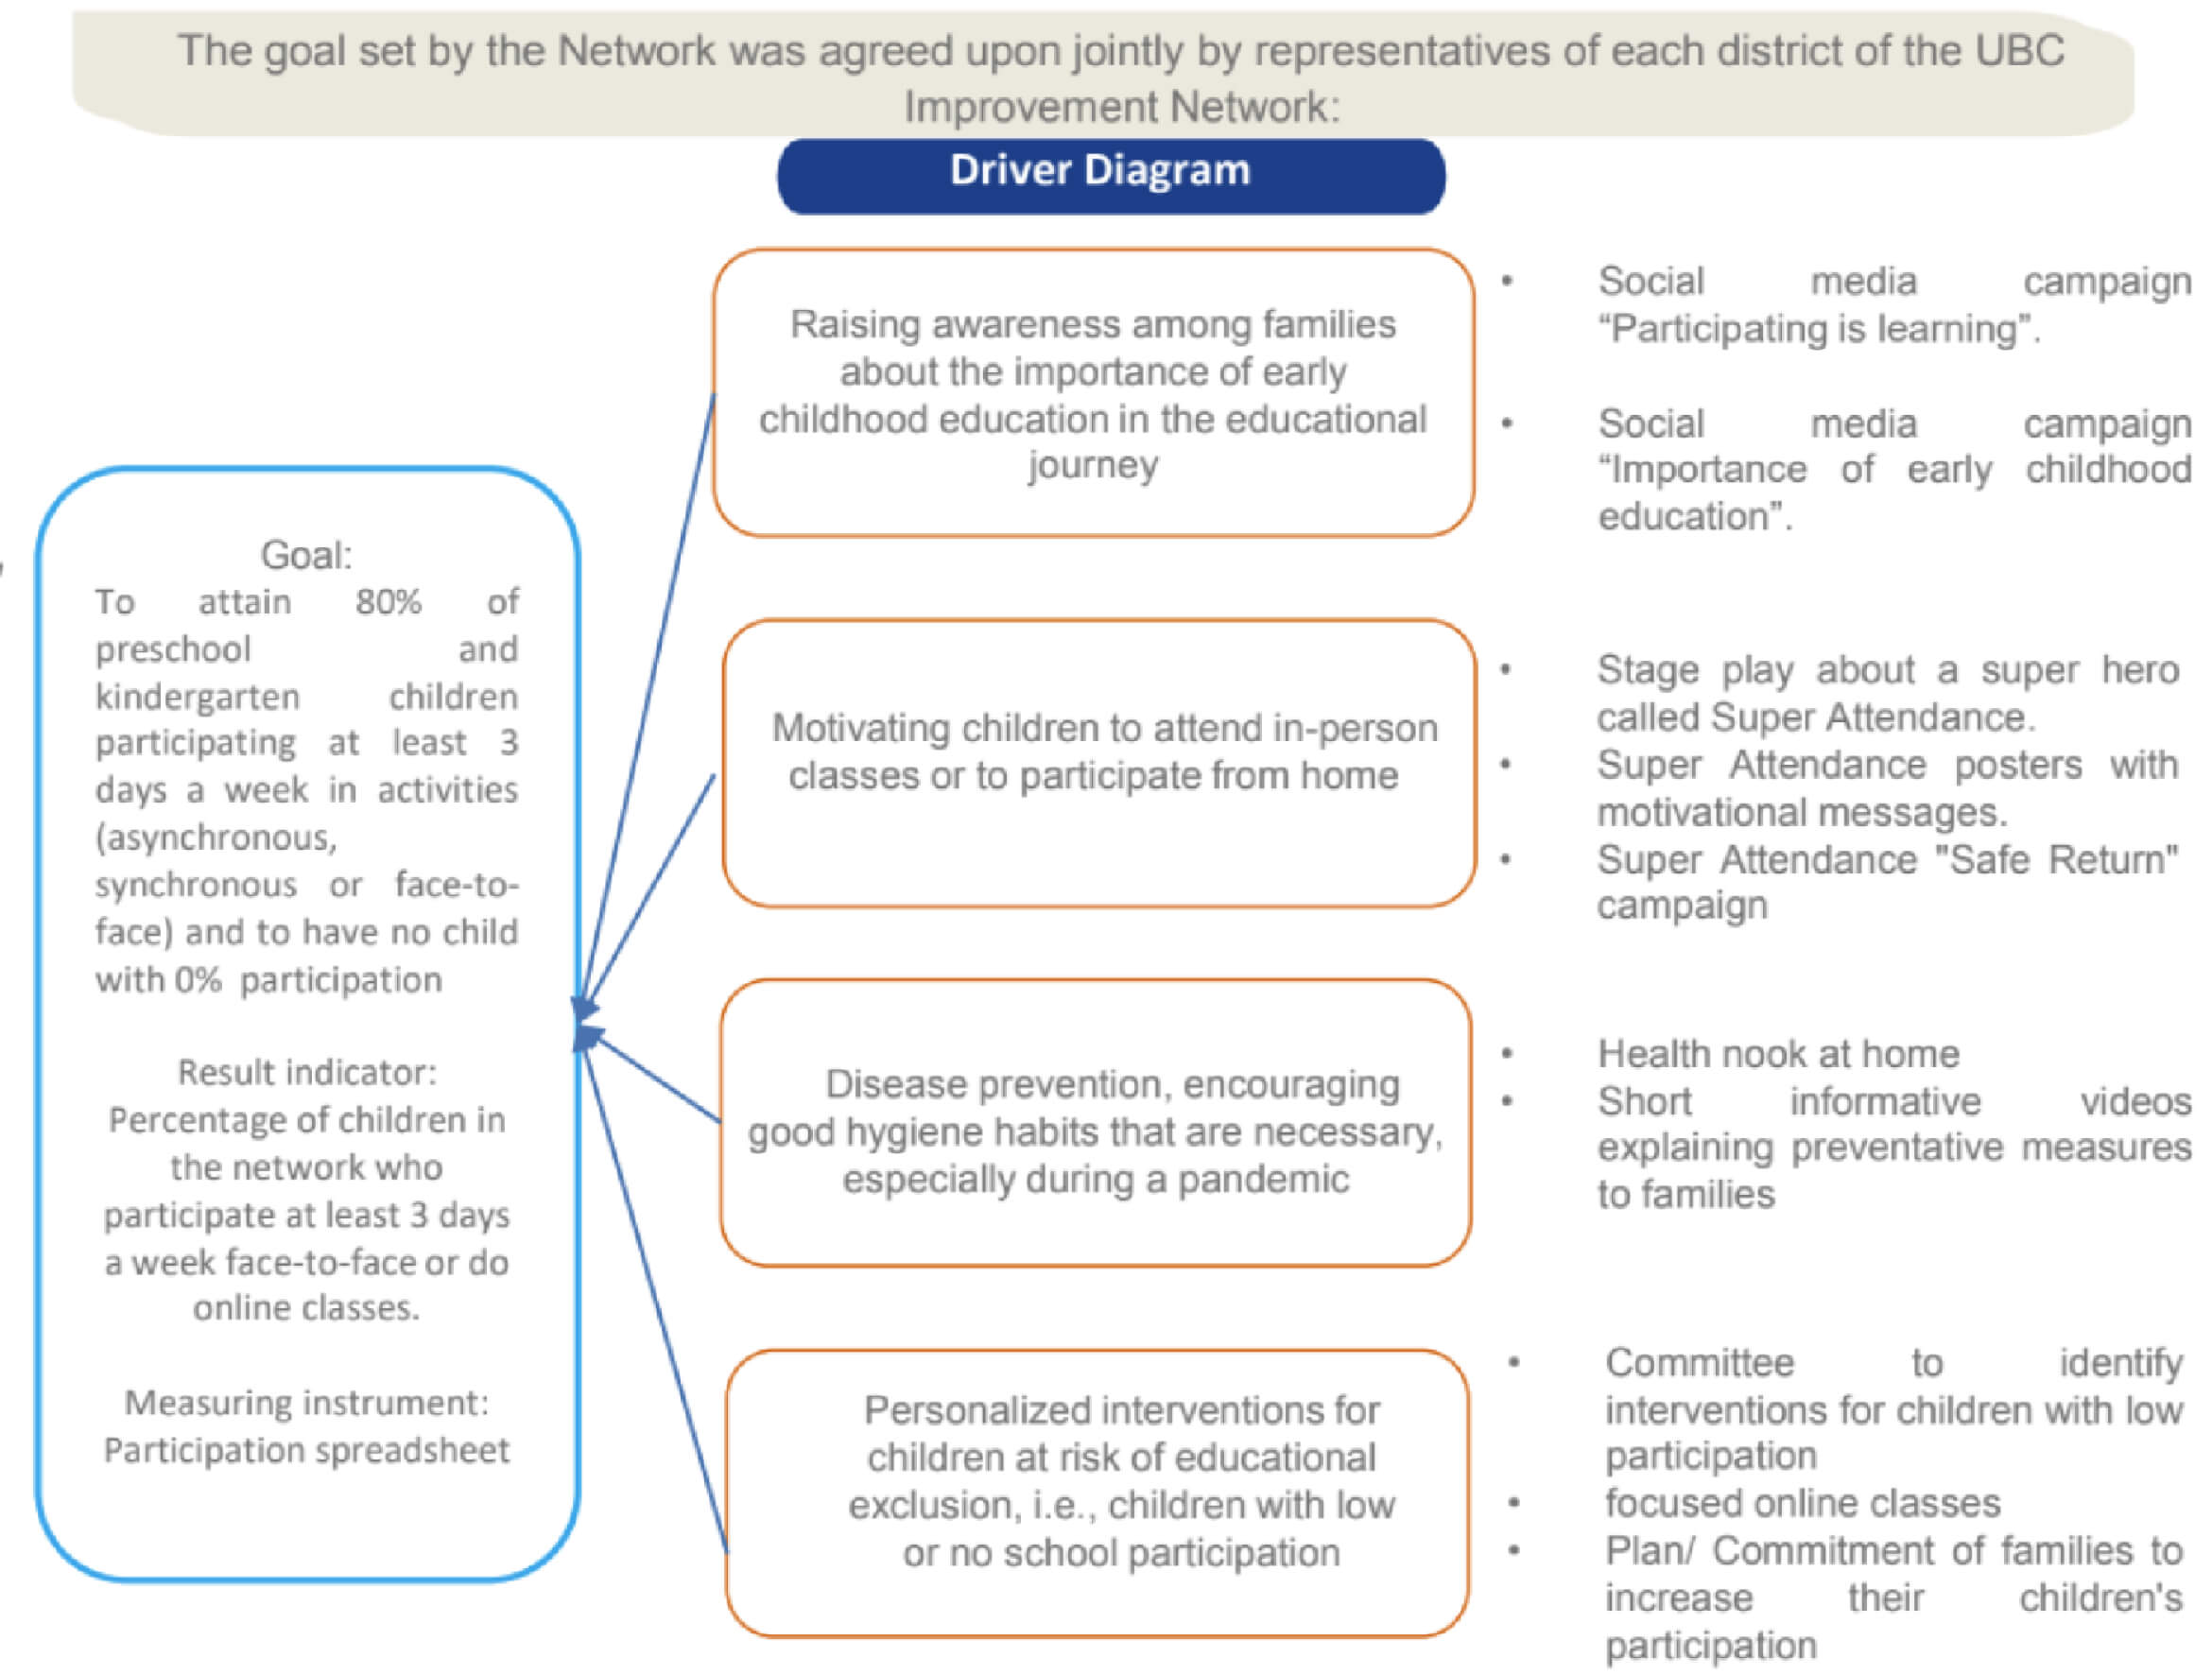
Figure 1. UBC Network’s Driver Diagram (2018-19) with primary driver focusing on attendance

However, in 2020, as the COVID-19 pandemic dramatically altered the way schools were operating across Chile, the Ministry of Education no longer required schools to submit classroom attendance data. With the General Student Information System no longer in use, schools lacked a way to monitor student attendance and needed the ability to understand whether students were engaging in the new structures for remote learning. Schools needed better visibility regarding which students were falling through the cracks.
This dramatic change in context prompted the UBC Network to shift its efforts and theory of improvement to focus on student participation (see Figure 2), and they developed a measure and new data-collection tools to monitor their progress. A key challenge the network encountered as they shifted their overall aim was to clearly define what was meant by “student participation” as opposed to “student attendance.” Most people share a common understanding of the term “attendance” as it relates to schooling – it is a measure that indicates how often a student comes to school or attends a specific class. However, the UBC Network recognized that this measure was no longer relevant as schools were implementing various forms of remote learning experiences. With this new perspective, the network turned its attention to “student participation,” which they defined as the interaction of students with the school through different learning activities such as worksheet packets, synchronous online class sessions, and face-to-face instruction. (These activities varied widely by school depending on the student population, school location (rural vs. city), and other factors).
Figure 2. UBC Network’s Driver Diagram (2020-21) with aim focusing on student participation
The Measure: Participation Spreadsheet/Tracker
The network hub created a Participation Spreadsheet/Tracker (sample spreadsheet translated to English) that allowed teachers to enter the activities that each student engaged in each week. The Participation Spreadsheet/Tracker includes a tab that provides clear instructions regarding how teachers should categorize each learning activity (which was important given the broad range of activities at each site) and tabs for each month where teachers track each students’ participation. Under the data table for each month, the spreadsheet also includes a summary table that automatically displays which students met the participation target (three or more activities) each week.
The core purpose of a practical measure for improvement is that it provides usable, relevant information to front-line practitioners to inform their practice and their improvement efforts. The Participation Spreadsheet/Tracker that the UBC Network developed, although relatively simple, responded to a key need that schools and educators faced, particularly as their work shifted during the pandemic. The student participation data collected with this tool allowed teachers, school administrators, and network leaders to track progress toward meeting their revised aim of 80% of children participating in at least three learning activities each week. Additionally, most teachers found the data collection form easy to use (when internet connectivity was not an issue), and the summary table provided timely data that indicated which students school staff might need to follow up with regarding low participation. The hub team also embedded social processes and routines in network meetings to support collective learning around the data to improve outcomes across sites, which are discussed further below.
Insights from Using the Measure: Developing routines for data collection and network learning
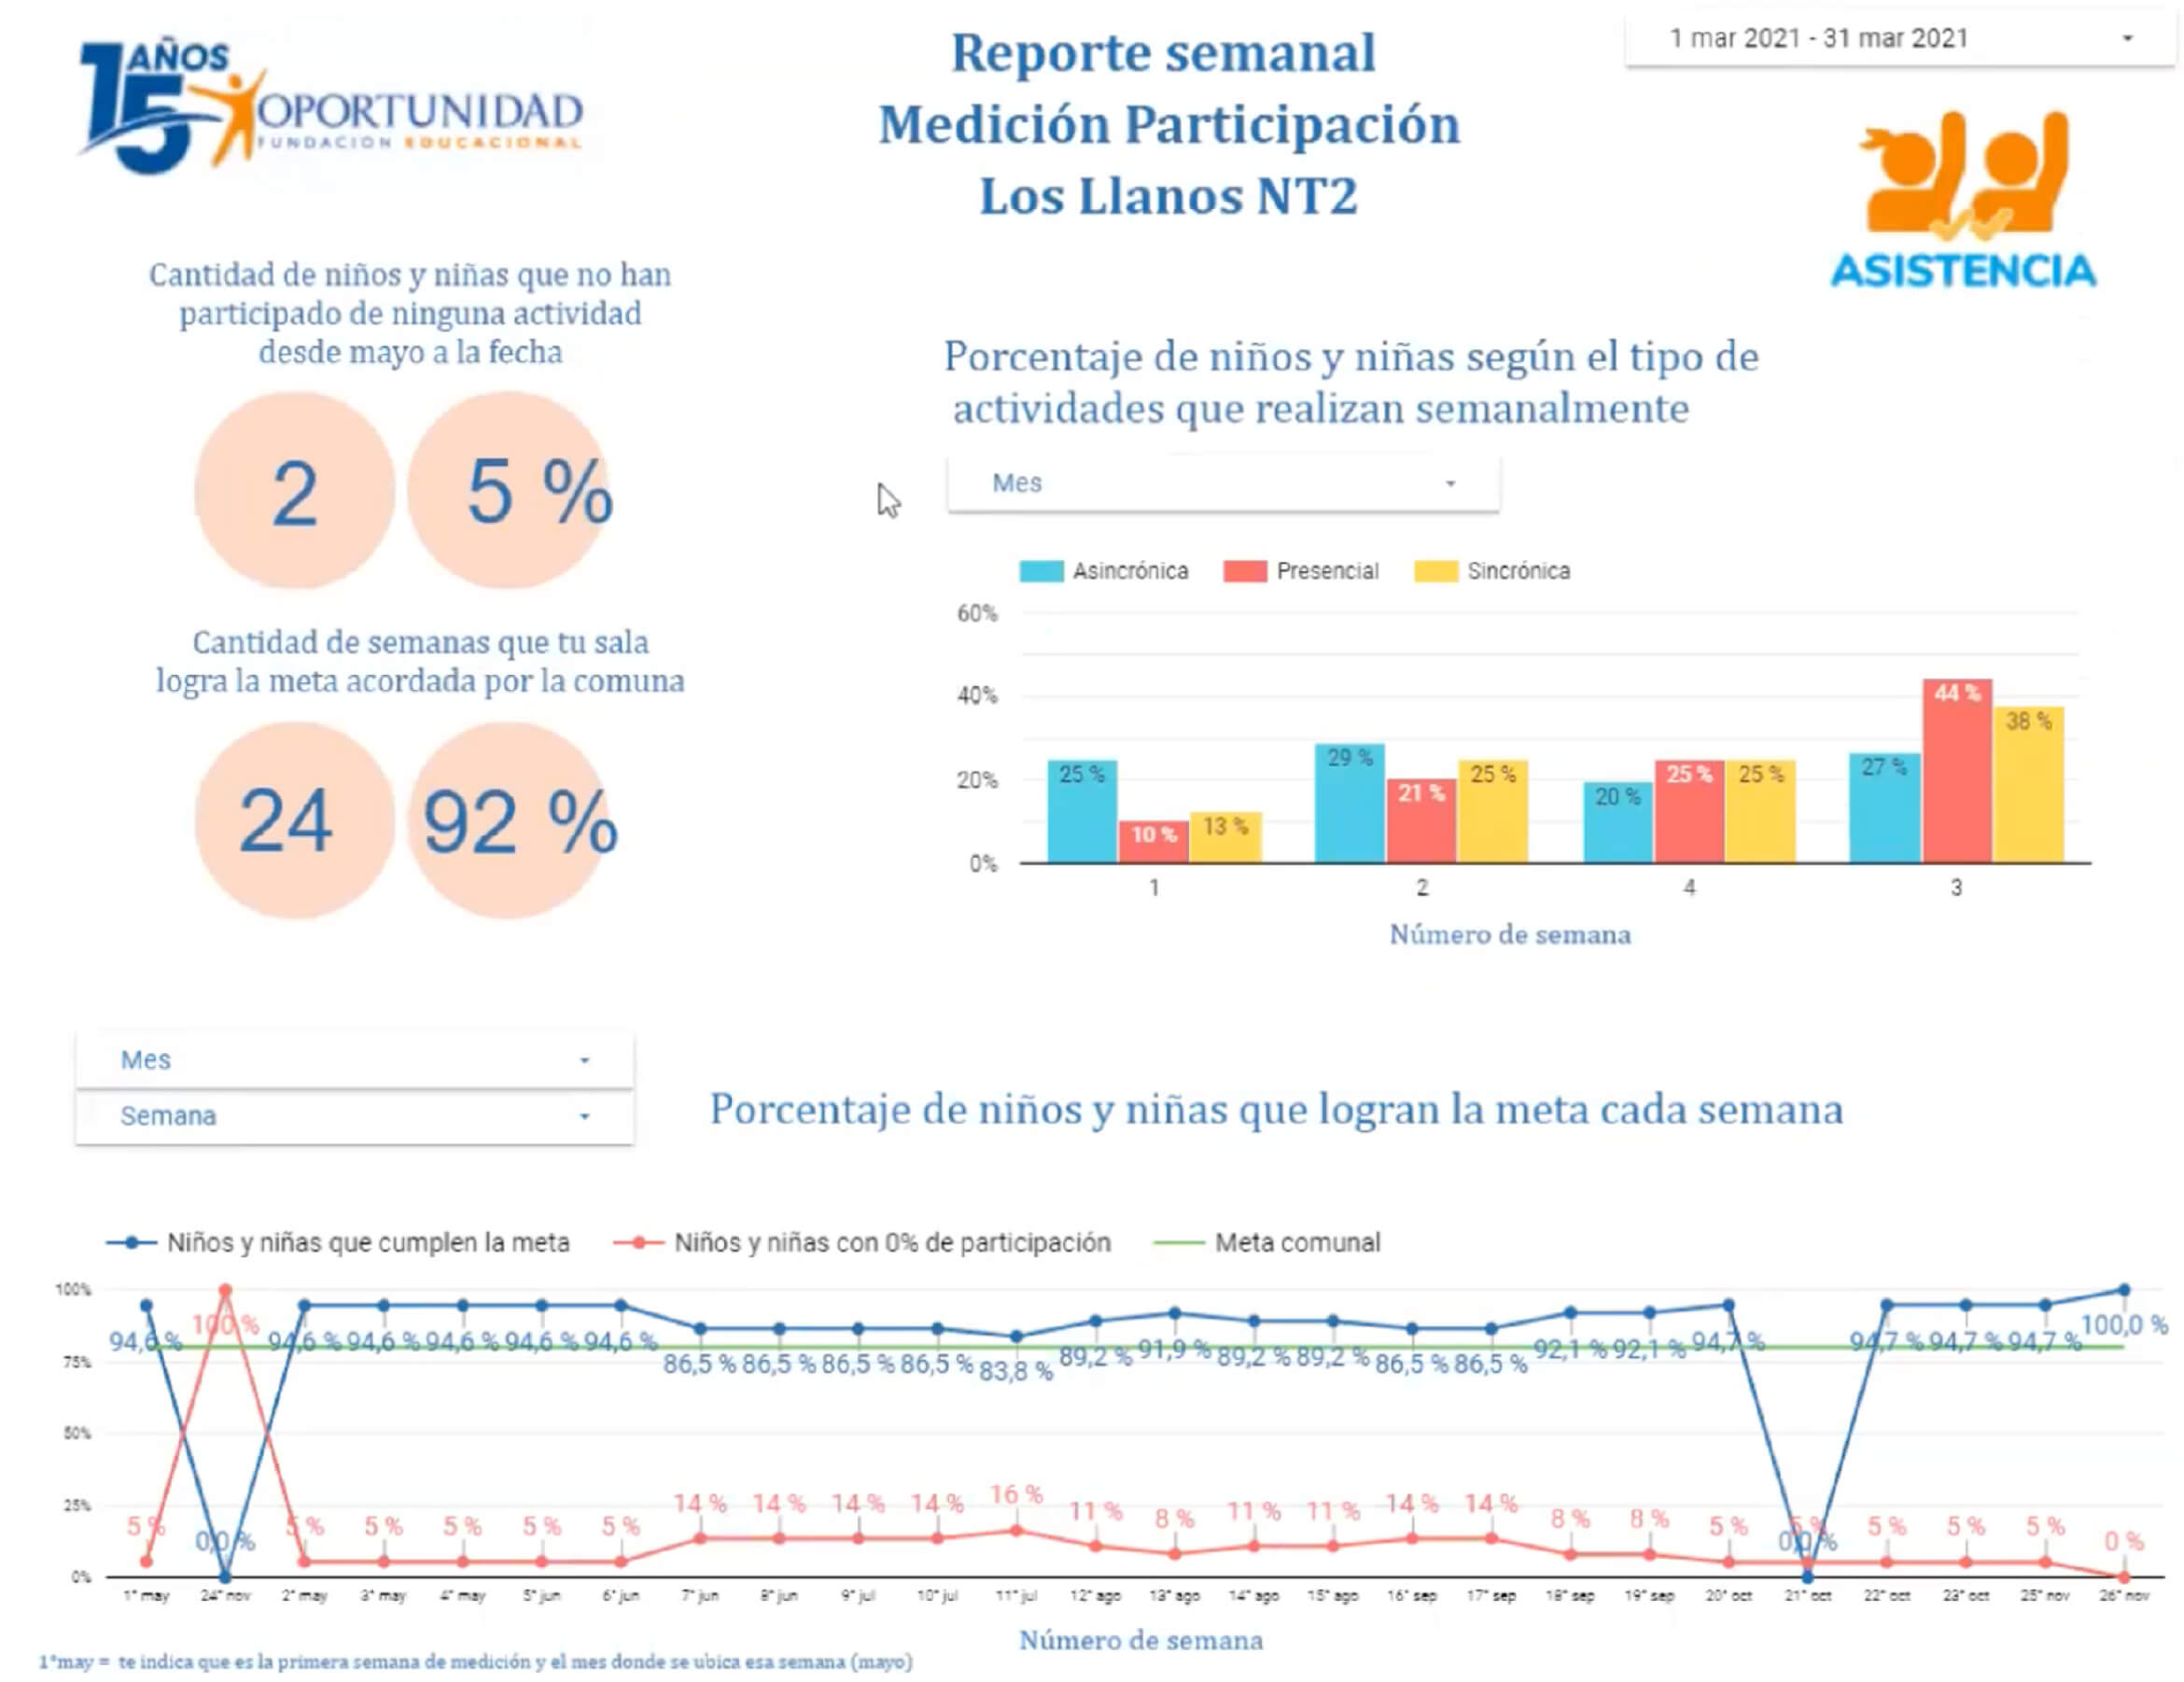
In order for a measure to provide actionable information and guide learning across a network, it is important that clear routines regarding data collection are established. To support use of the Participation Spreadsheet/Tracker, the hub created a spreadsheet for each classroom in the network. Each week, teachers were asked to complete the spreadsheet by indicating each student’s participation. These spreadsheets were linked to DataStudio, which generated reports for individual classrooms, an entire district, and for all students in the UBC Network. Every Monday, the hub team shared weekly classroom- and school-level reports with teachers and school leaders (see Figure 3). School staff used this information to evaluate how they were doing and consider strategies to improve participation.
Figure 3. Participation report for one school in the network
To support learning and improvement across the network, one person from each district was assigned as the point person focusing on the participation improvement effort. This participation/attendance manager received additional training from the hub regarding strategies to improve attendance and participation. They also led monthly meetings in their district to encourage school leaders to share instructional and leadership practices. During these meetings, the participation/attendance manager shared their district’s participation data and led school teams to analyze the data and share best practices. Based on these discussions, the teams then identified strategies to test using Plan-Do-Study-Act cycles in order to improve students’ participation in the different learning experiences. At the end of the year, representatives from all the districts in the network met with the hub team to discuss the participation data and to identify lessons learned.
Impact of Measurement for Improvement
As schools shifted to new models during the pandemic, many students in Chile and around the world experienced educational exclusion because of difficulty accessing remote learning activities. Utilizing the Participation Spreadsheet/Tracker allowed schools and classroom teachers in the UBC Network to identify children with low participation and implement targeted strategies to prevent them from experiencing further educational exclusion. Additionally, analyzing participation data at monthly district meetings promoted knowledge sharing between school teams and supported them in developing timely strategies that responded to local realities.
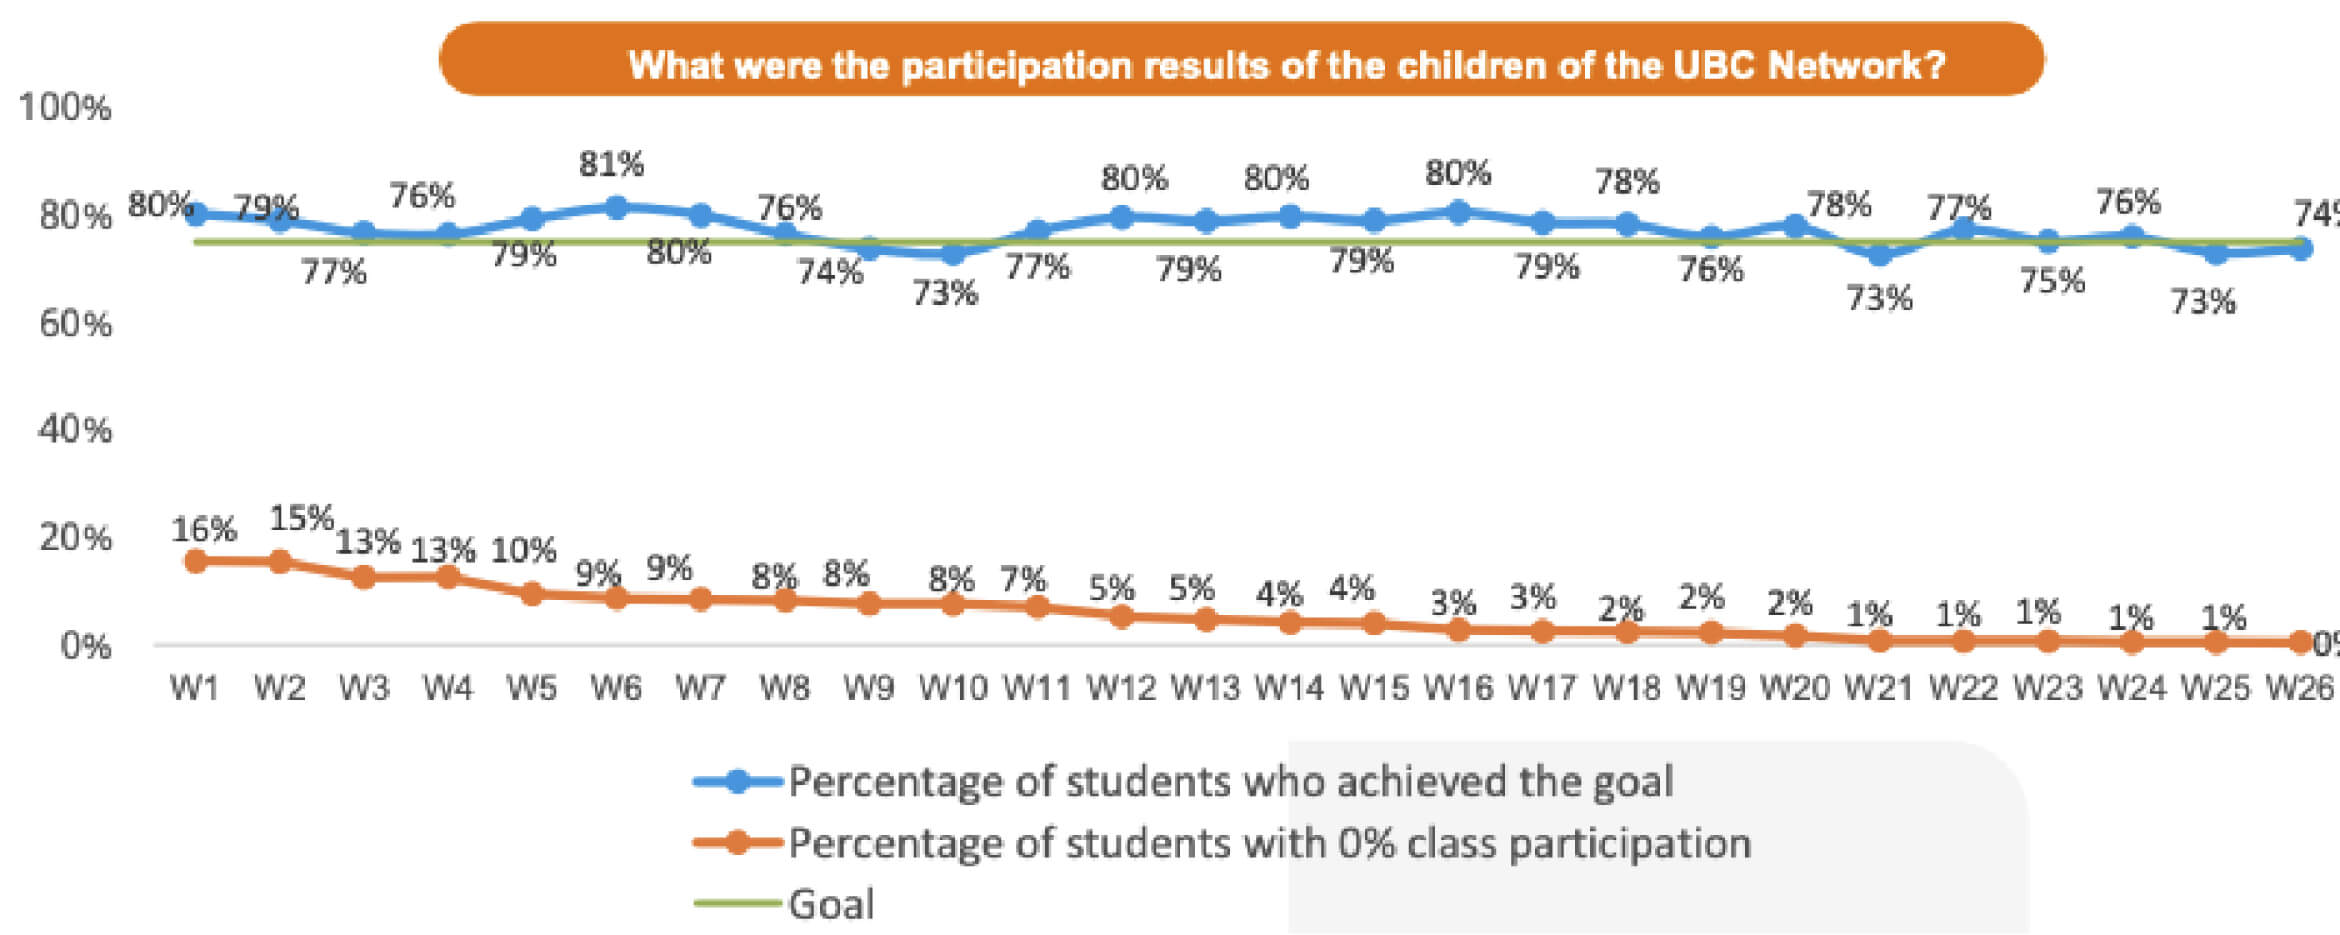
Based on the data recorded in the Participation Spreadsheet/Tracker, the UBC Network made significant progress toward achieving their aim from May to December 2021 (26 weeks). 75% of students participated in at least three learning activities per week in 22 out of the 26 weeks. They also reduced the percentage of students not participating in any learning activities each week from 16% in Week 1 to 0% in Week 26 (see Figure 4).
Figure 4. UBC Network Participation Data from May to December 2021
Related

TECHNICAL PAPER
Participation Measurement
Following the increase in educational exclusion during the pandemic, the Un Buen Comienzo (UBC) Improvement…
You may also be interested in…

RESEARCH BRIEF
Developing Exit Tickets in an Improvement Network
Ms. Johnson, an English teacher at an urban middle school, was concerned that her students were not doing as well in her class as they could be. Her district had recently…

RESEARCH BRIEF
Case Study of ORF as Practical Measure Brief
In this post we describe the identification and use of Oral Reading Fluency (ORF), a common and widely used Curriculum Based Measurement (CBM) measure, as a…